[Alibaba Cloud Thailand] DataV Dashboards: A Crash Course
By Saris Kongpichetkul, Presales Engineer of ATCETERA CORPORATION LIMITED and partner of Alibaba Cloud ThailandWhat Is DataV? __________________________________________________
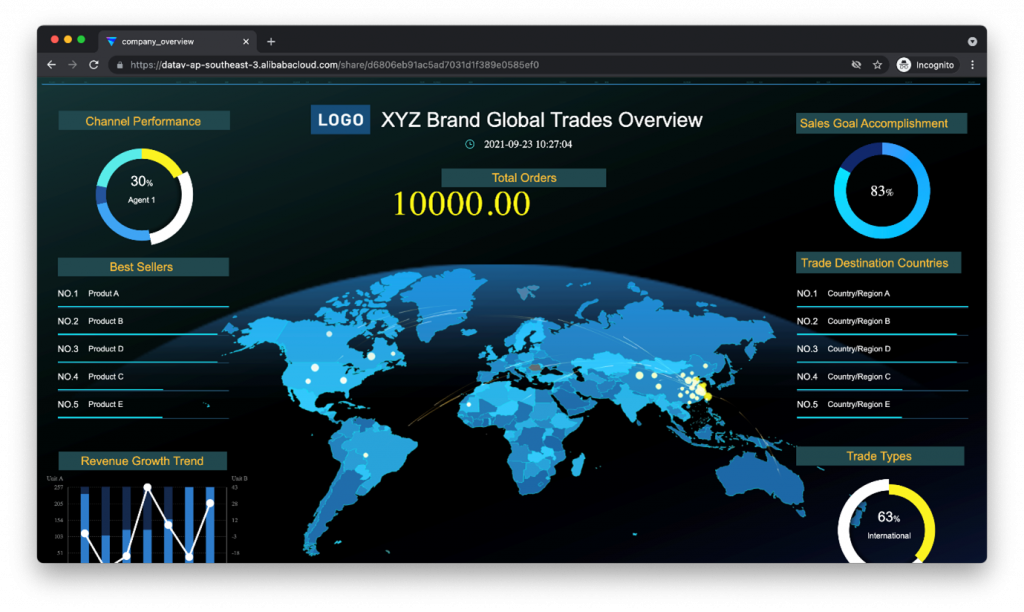
In simple terms, DataV is an Alibaba Cloud data visualization tool which helps you build interactive, multilayered data display boards that can be updated in (near) real time. DataV is the sort of tool you use when you’re building a data display board to show off to customers, put in your lobby, or stick on a monitor in the CEO’s office. Unlike traditional BI tools, it produces interactive, engaging visual displays that incorporate complex elements like 3D maps. DataV’s ability to update displayed data automatically also makes it an ideal tool for creating status dashboards that can be used to understand the state of a system or process at a single glance. Here are a couple of DataV dashboard examples. Feast your eyes! You now know how to create a DataV dashboard from a template, make adjustments to style and data sources, publish your dashboard, and check that it is working as intended! For more information on how to create and edit DataV dashboards, check out the Quick Start guides in the official documentation. See you next time!
So What’s The Downside?__________________________________________________
There’s really only one: DataV is expensive to experiment with, as an individual. The cheapest edition (Basic Edition) available on alibabacloud.com is 360 USD per year. It’s a subscription-only product, so there’s no way to purchase it on a Pay-As-You-Go basis. The other two editions, Enterprise and Professional do offer a shorter subscription period (as short as one month) but are also fairly expensive. A month of Enterprise costs 300 USD, making Basic the best deal if you are just starting out. That’s one of the reasons for today’s blog post: I want to show you what DataV can do without requiring you to spend any money! I won’t go into a lot of details here about the differences between the different editions: essentially, the more expensive editions allow you to create more data display boards, handle more input data source types, and support some advanced charting and modeling features.Creating A Dashboard __________________________________________________
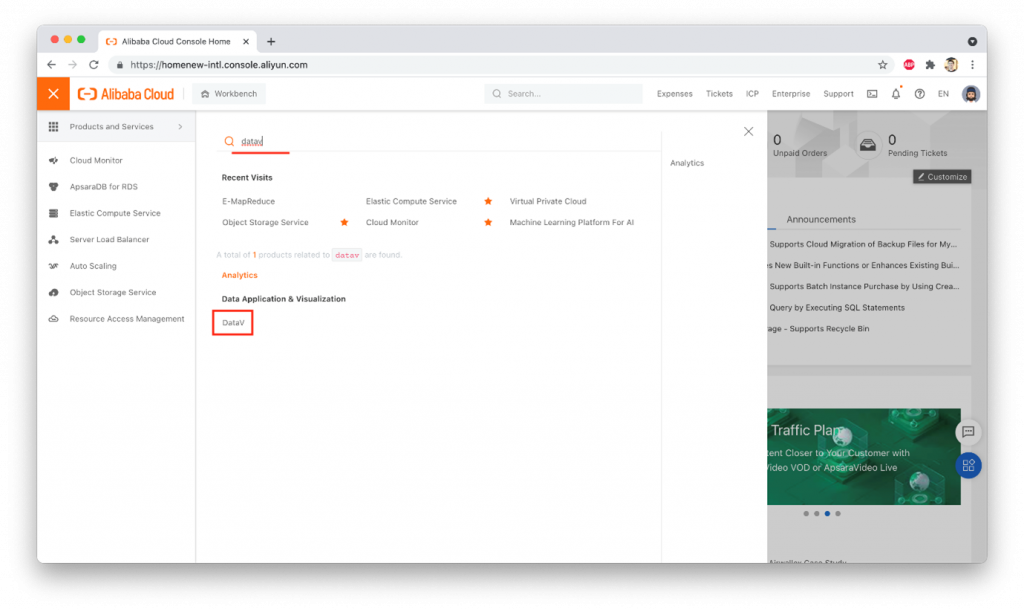
Let’s go through the process! As an employee, I have access to a test account, so I was able purchase the Professional Edition. First, we need to get into the DataV console, from the Alibaba Cloud console homepage: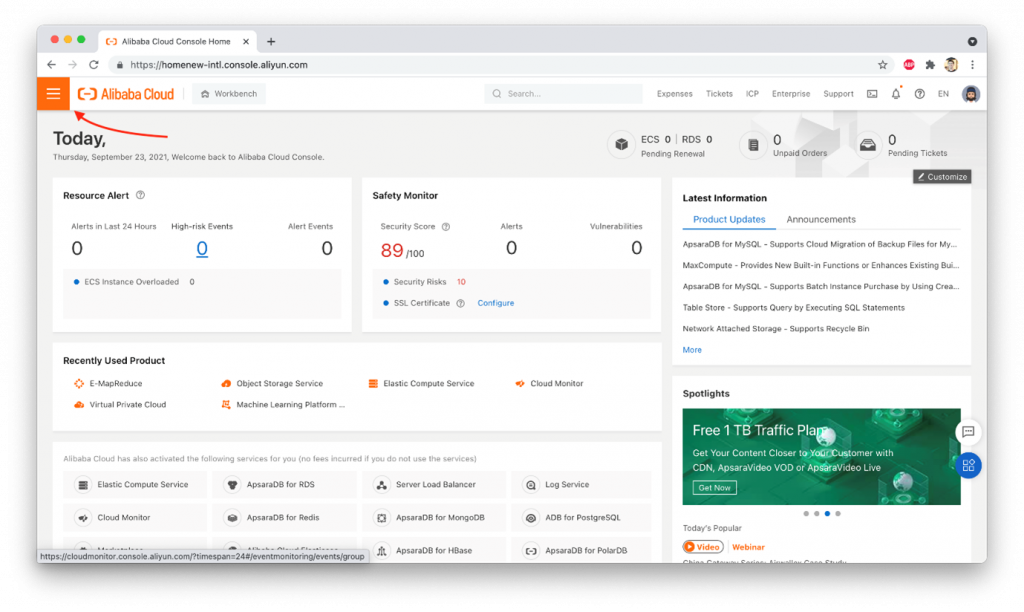
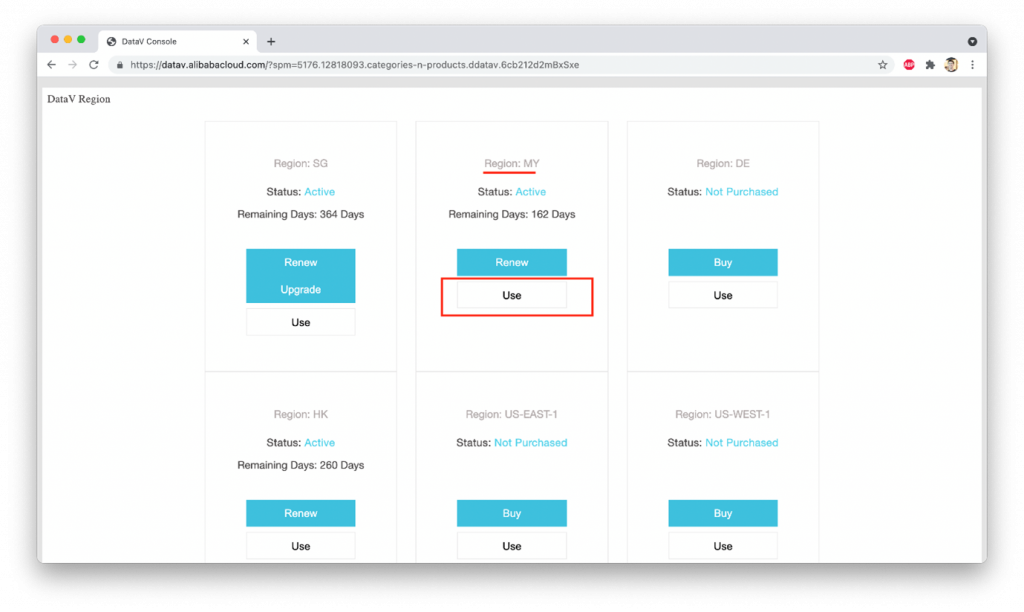
Next, we click the “Use” button under “Region: MY”:
This takes us to the DataV homepage:
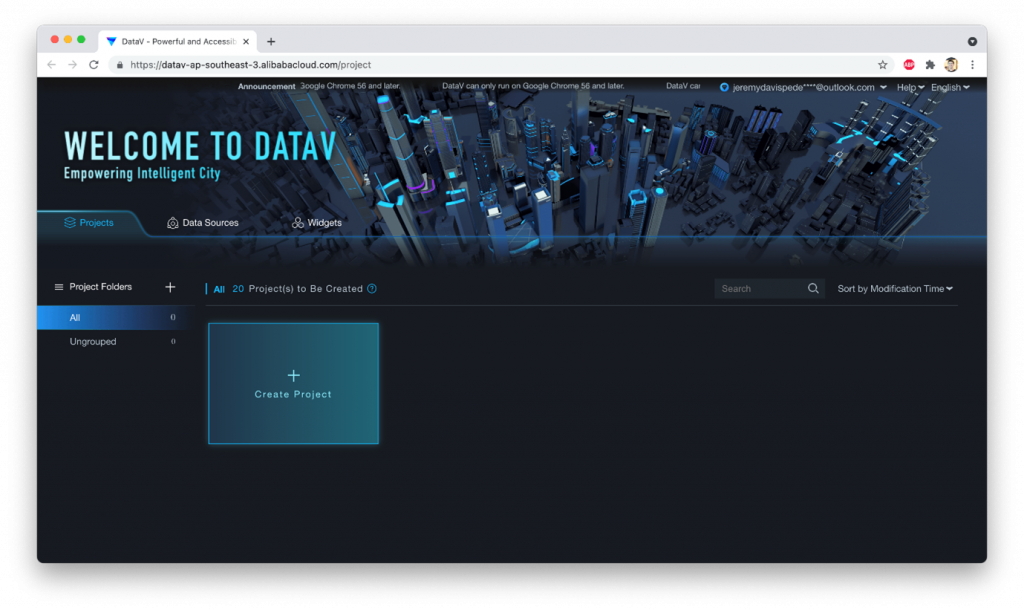
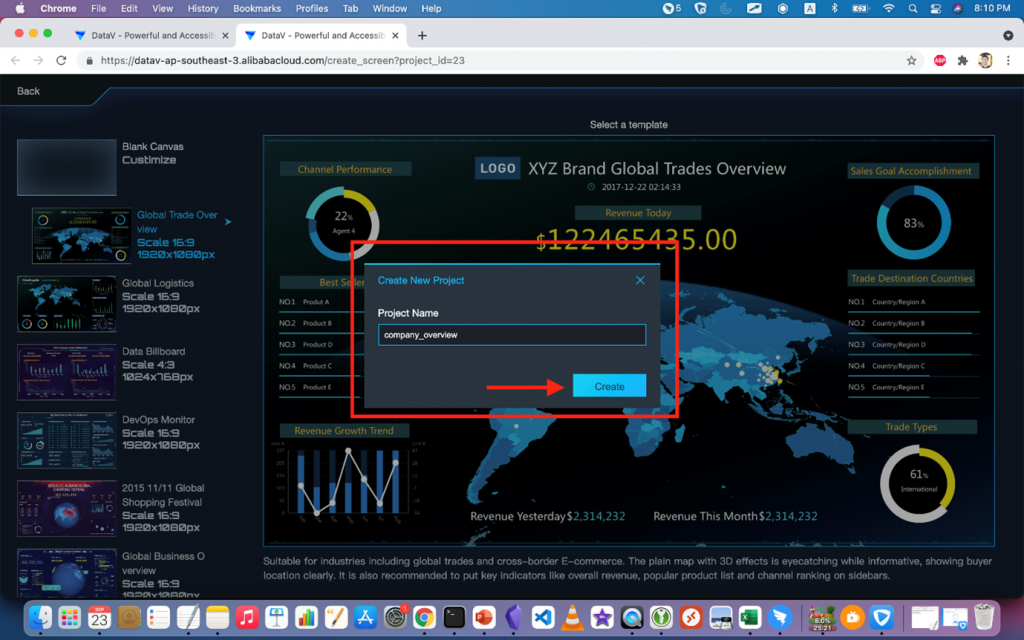
Clicking on Create Project will allow us to create a new project (a “Screen”) either from a blank template, or one of DataV’s many pre-built templates. For the demo, I’ll use this template:
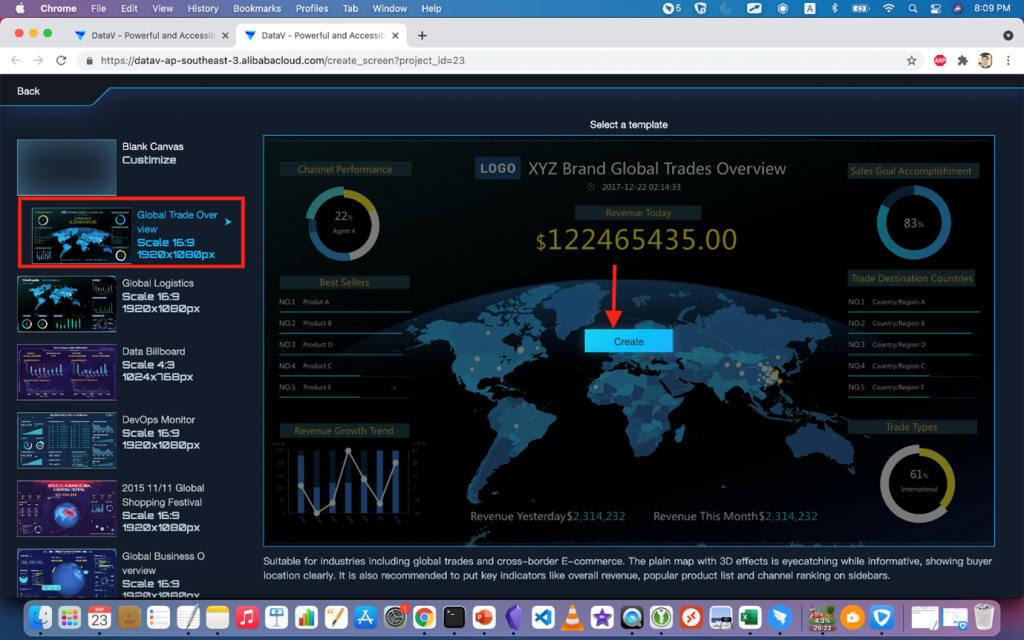
I give the new display a name, then click on “Create”:
That’s it! We’re now ready to make adjustments to the display, add new elements (called “widgets”), adjust colors, style, sizes, and positions, and of course add some data sources.
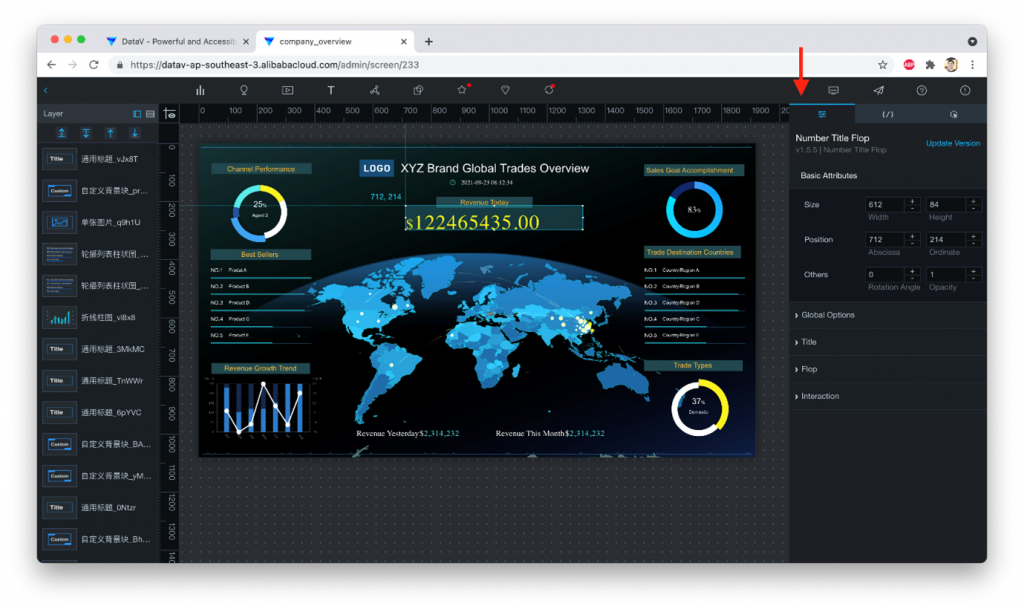
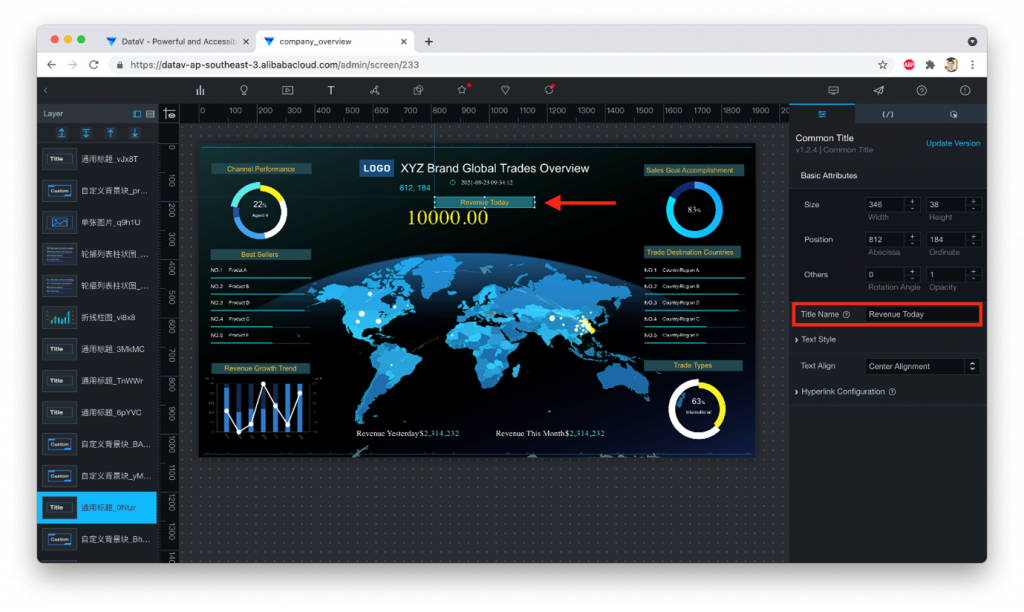
If I click on a widget, such as the “revenue” widget near the top of the board, a side-pane will open on the right.
There are three tabs in the side pane. The first one (shown below) lets me make stylistic adjustments to color, font size, etc…
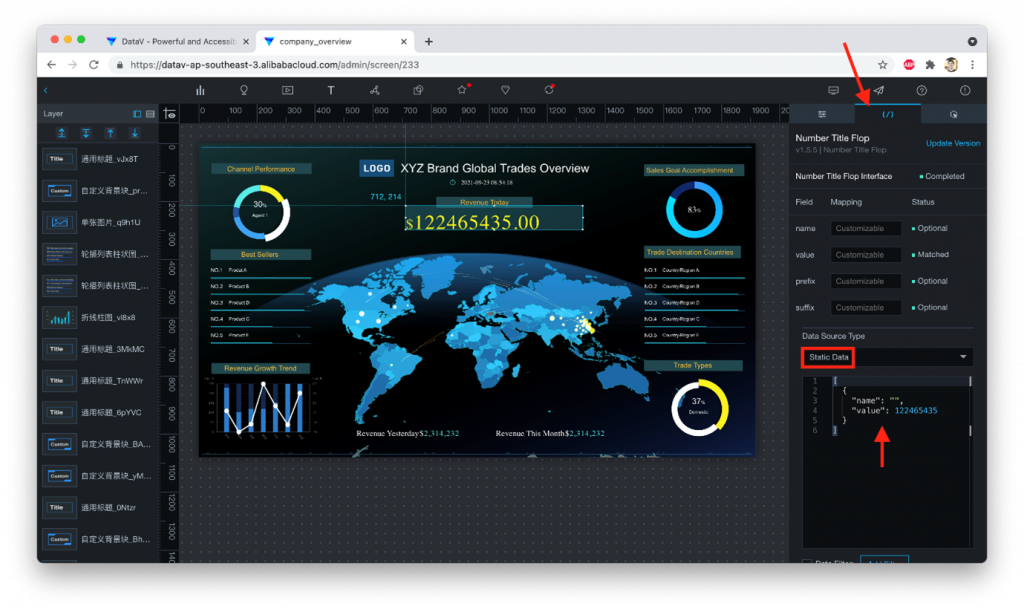
The second tab lets you set the “data source” for the widget. By default, widgets use “Static Data” as their data source: usually this means a JSON-formatted text document. For small amounts of data that do not change frequently, you can insert data directly into the widget by updating this “Static Data” source:
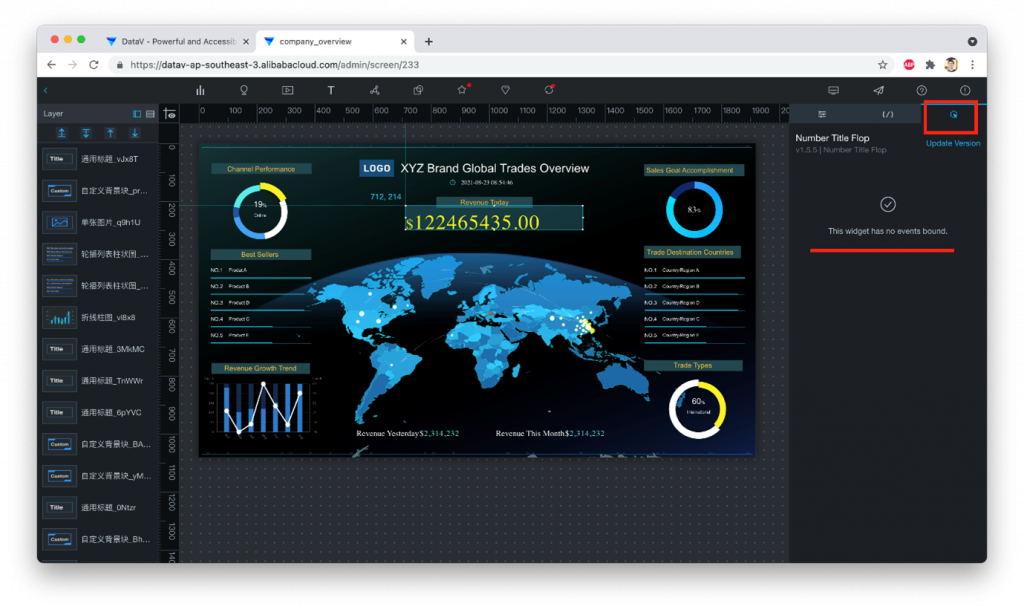
The third and final tab allows you to bind an event to the widget. When users click on the widget, this will trigger an action such as changing the display properties of the widget. For instance many of the map widgets built into DataV will highlight or enhance a particular area of the map when clicked. In our case, this simple text-only widget has no actions bound by default (though we could add one, if we wanted):
Adding A Data Source __________________________________________________
For this next part, I’ll assume you have already followed along with this blog post which explains how to use Alibaba Cloud DMS to import data into a MySQL database on Alibaba Cloud’s RDS service. In my case, I’ve already set up a database in the Malaysia region containing the sample data from the above blog post: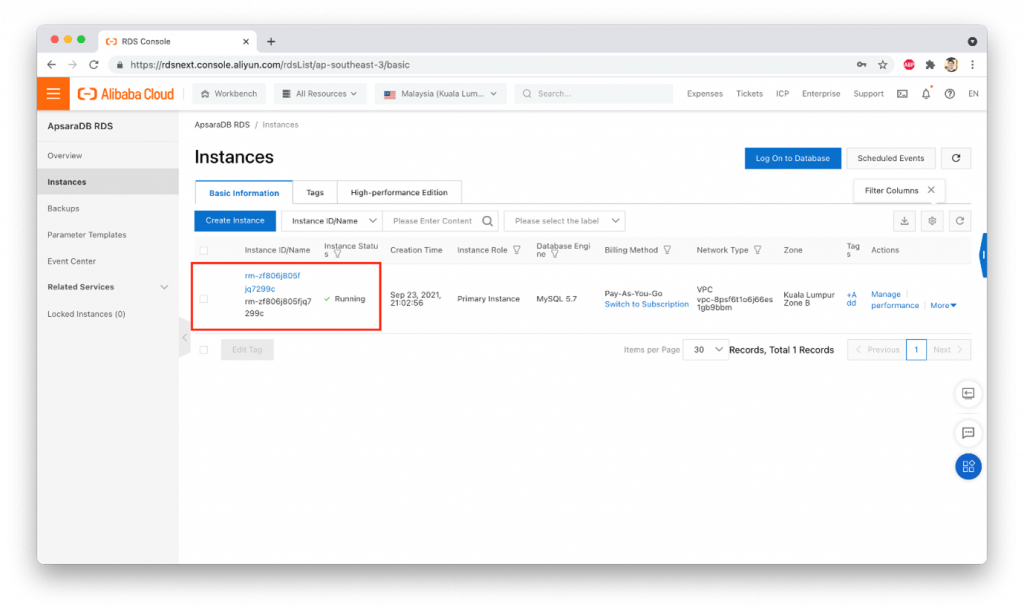
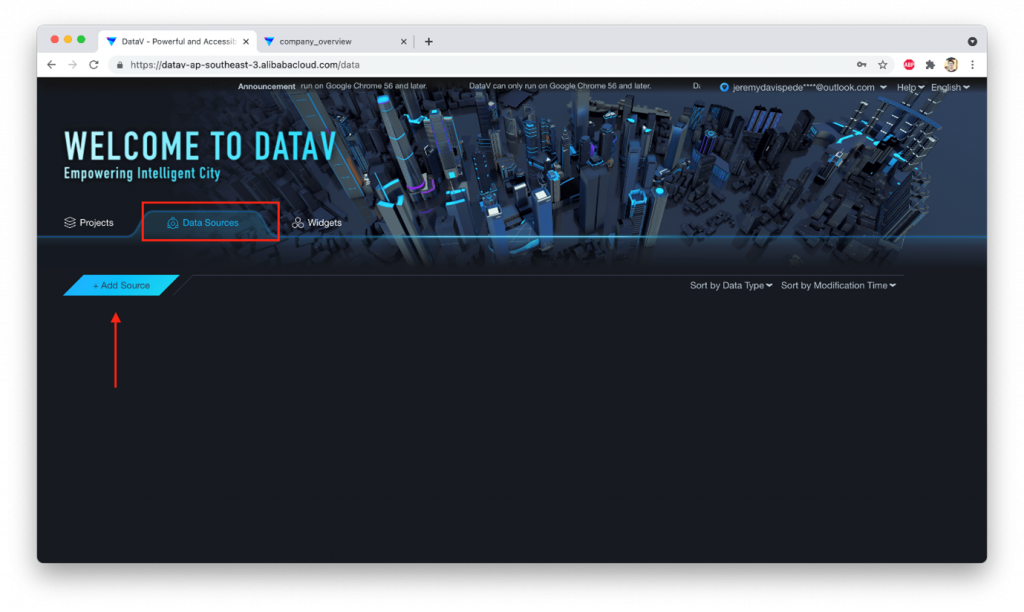
Going back to the DataV homepage, we need to select “Data Sources” and click on “Add Source”:
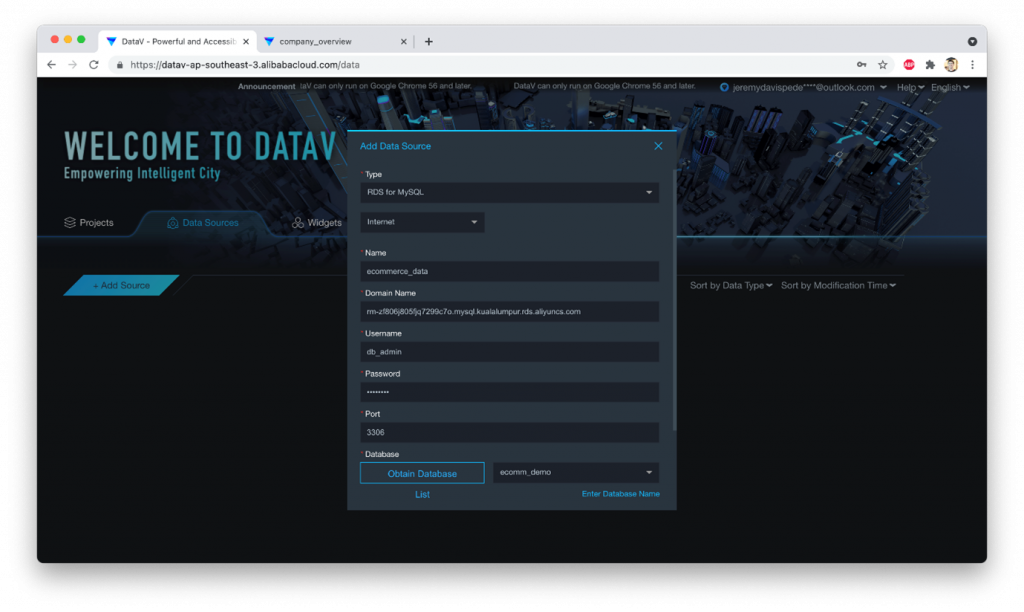
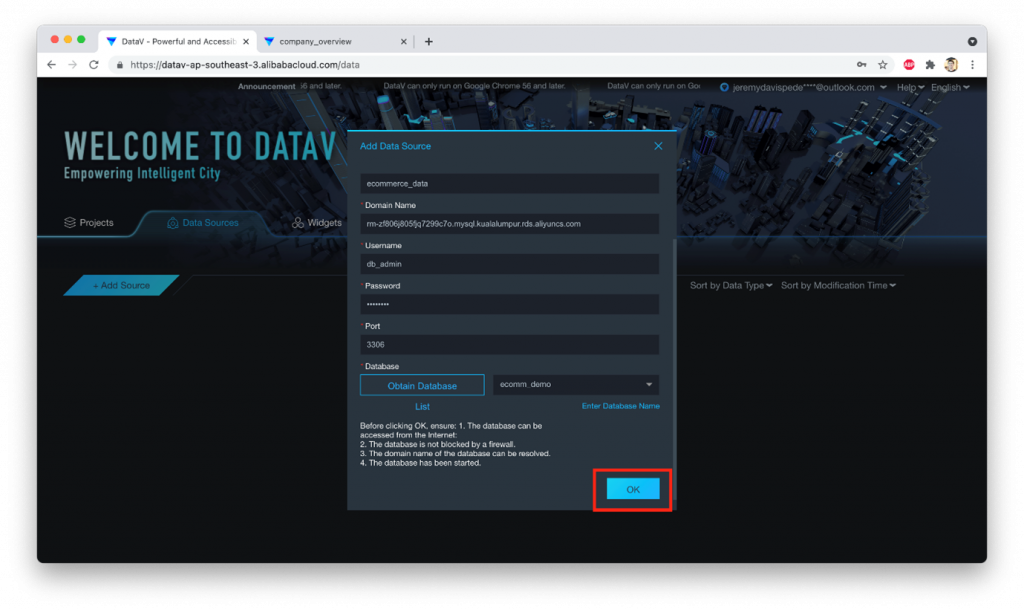
Next, we enter the connection details for our MySQL database:
 Note, you may need to follow these steps to add DataV’s IP address range(s) to your RDS database whitelist, before you can connect successfully.
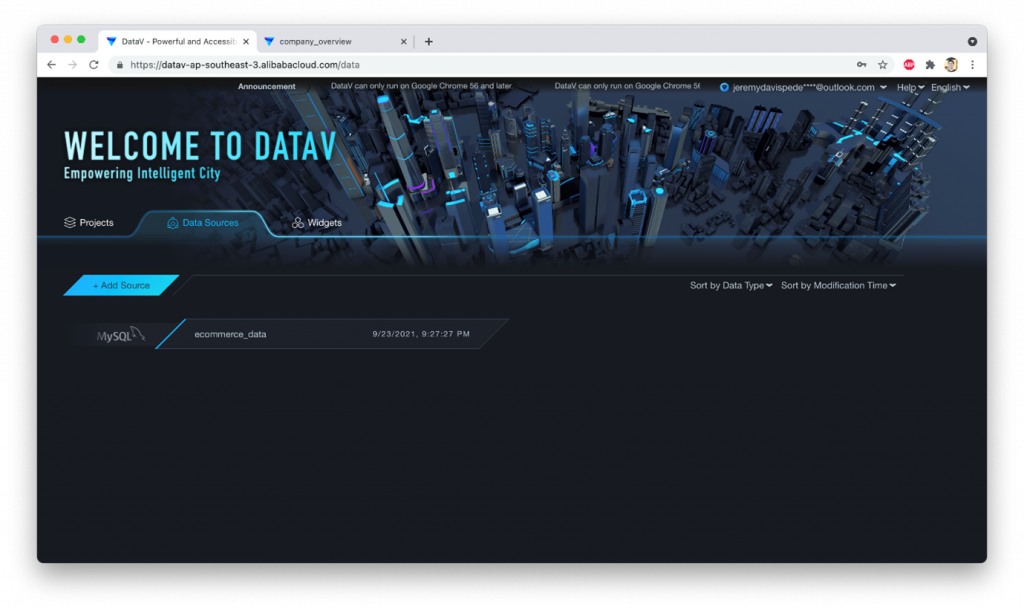
We should now see our new data source showing up:
Note, you may need to follow these steps to add DataV’s IP address range(s) to your RDS database whitelist, before you can connect successfully.
We should now see our new data source showing up:
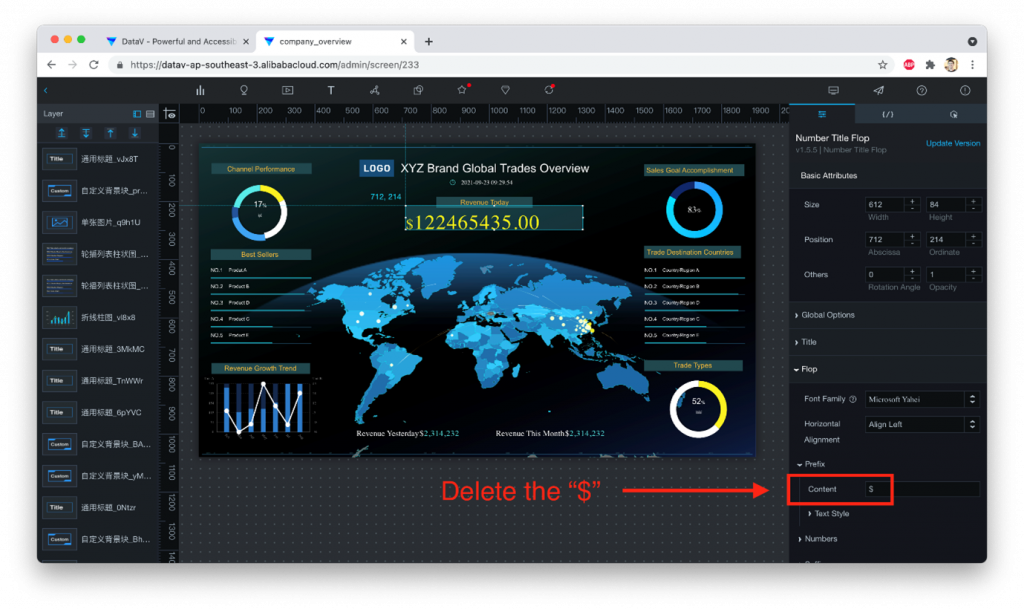
Great! Now we can make some changes to the “profit” widget at the top of our dashboard. Let’s get rid of the $ at the front (the “prefix”), and change the data source to point to our MySQL database:
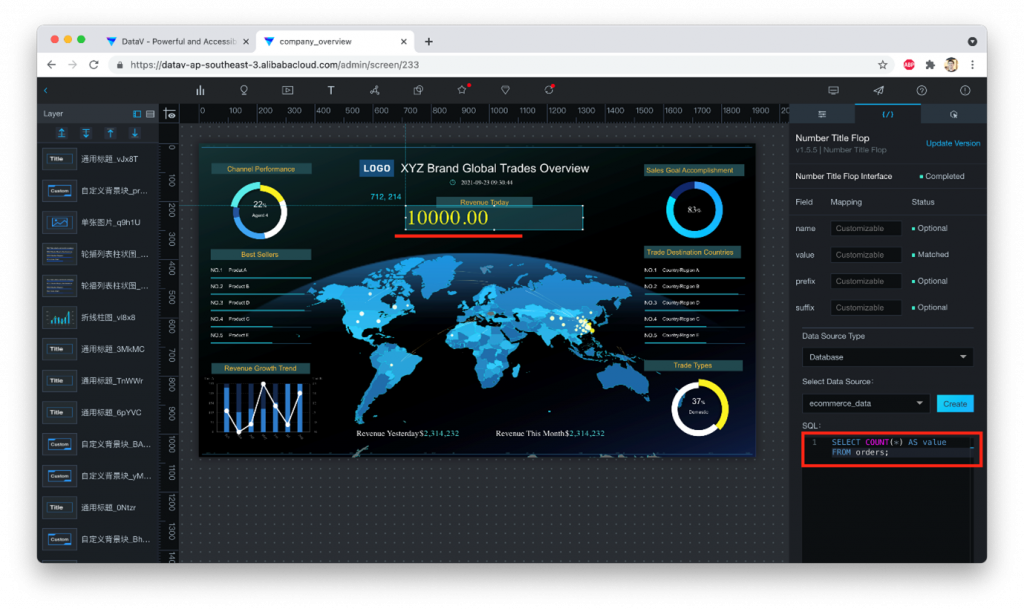
The SQL command we used is:
SELECT COUNT(*) AS value FROM orders;The AS value part is needed to make sure the output from our MySQL database has a column named “value”, since this is the field name that the DataV widget expects to see. If you look above the “Data Source” area you’ll see the “field mappings” that describe the field names (column names) that each DataV widget expects to see in your SQL output. You need to follow the field mapping naming conventions (and order) when pulling data into your DataV dashboard.
Turn On Automatic Updates __________________________________________________
We next need to make sure that our dashboard will update itself automatically:
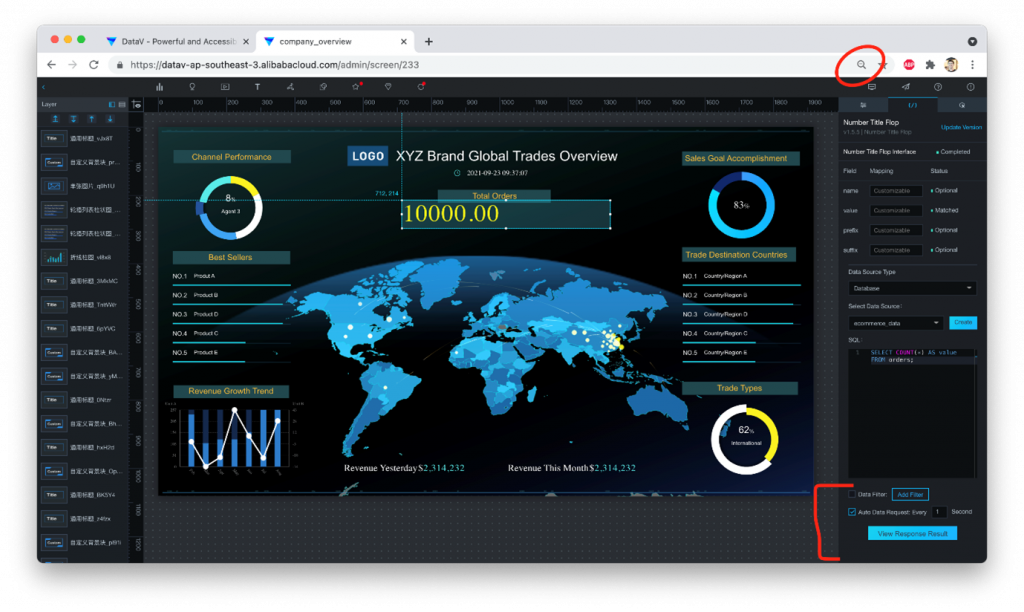
To see this, you might have to reduce the size of the DataV web console by changing your browser’s display settings. In Chrome on my mac, I had to scale down to about 70% before I could see the automatic update setting (in Chrome, you do this by pressing the “Control” and “-” keys (in Windows) or “Command” and “-” (on macs).
Check the box next to “Auto Data Request” (as seen in the screenshot above). The default interval of “every 1 second” should be fine here. You might want to update less frequently depending on how complex your SQL query code is.
Final Touches __________________________________________________
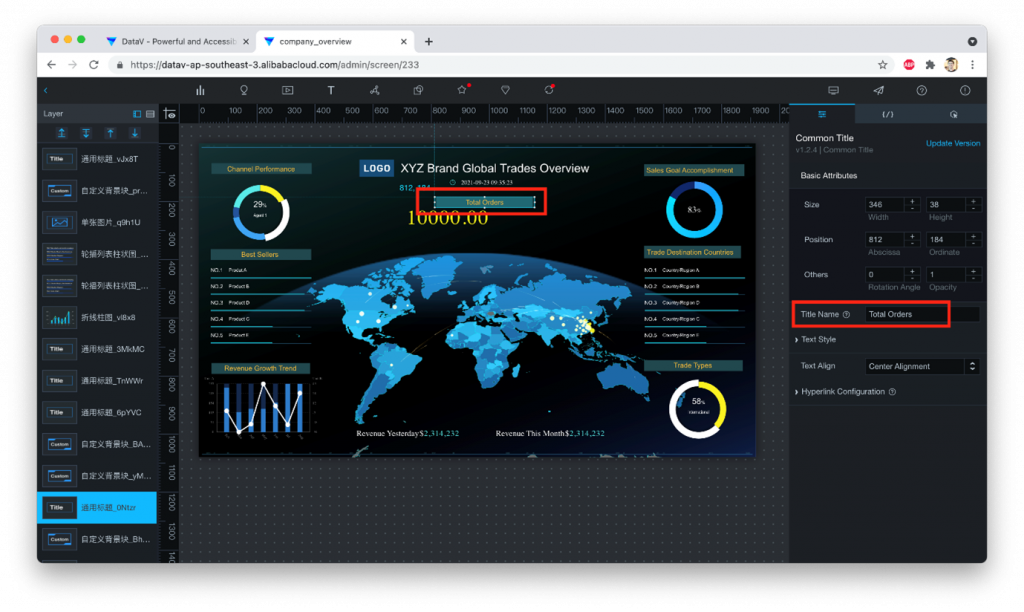
Let’s now change the text above our widget to read “Total Orders”:
Great, now let’s publish our DataV dashboard! This will make it available to anybody that has the URL (though we can add protection via a password or URL token, if we like).
Publishing Our Dashboard
__________________________________________________
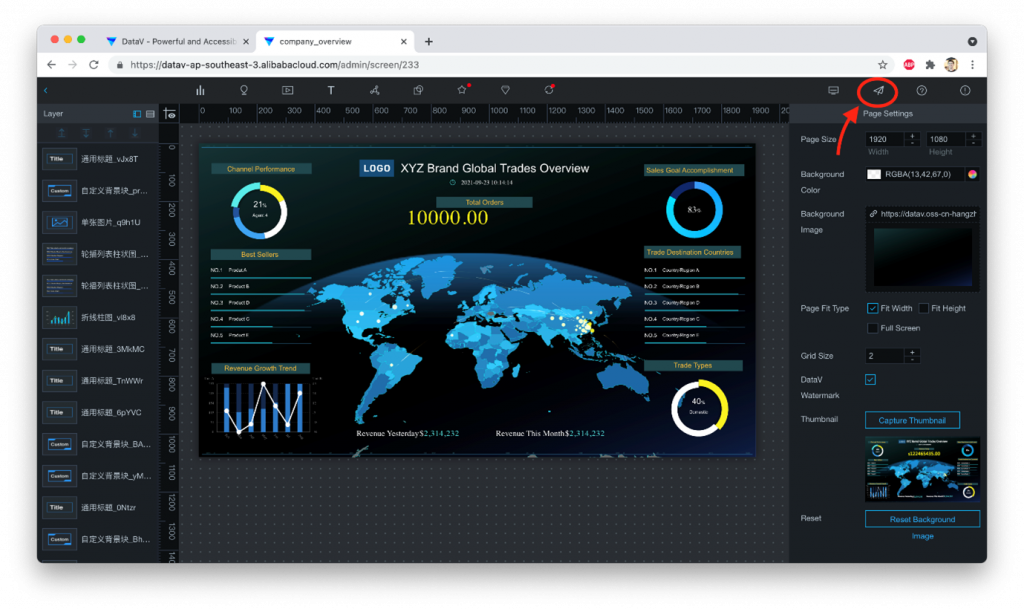
Once a dashboard has been created, publishing is pretty easy: just click on the little paper airplane icon in the righthand corner, like this:
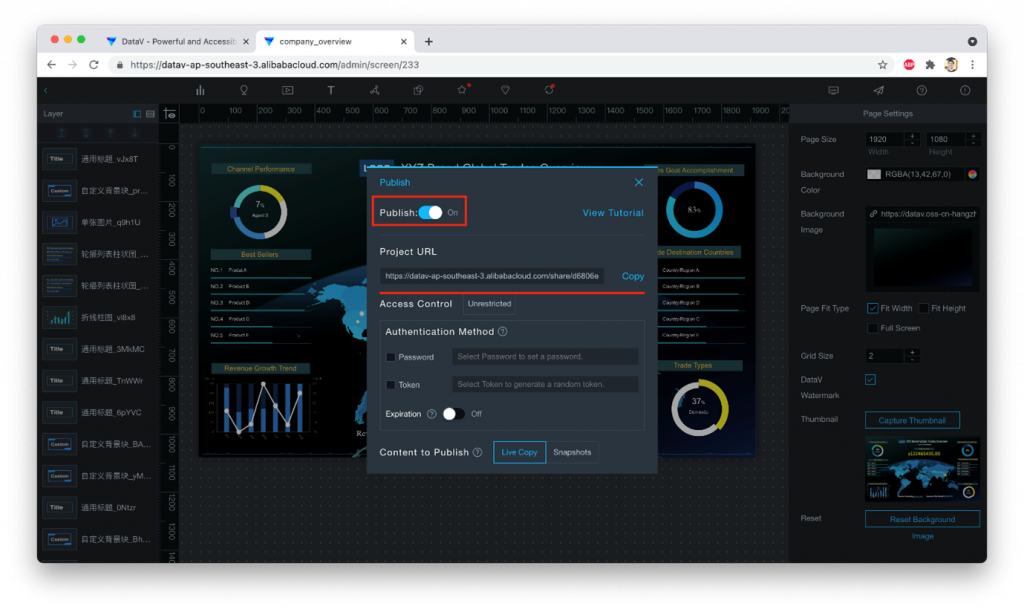
Slide the radio button next to “Publish” from the “Off” to the “On” position, and a URL will show up. That’s it! Your dashboard is live now.
We can visit the dashboard in a Chrome “incognito” window, just to make sure:
 Yep, it works! Let’s see if the number of orders is really auto-updating, by returning to the DMS console’s SQL editor window, and running some INSERT operations to add new items to the table:
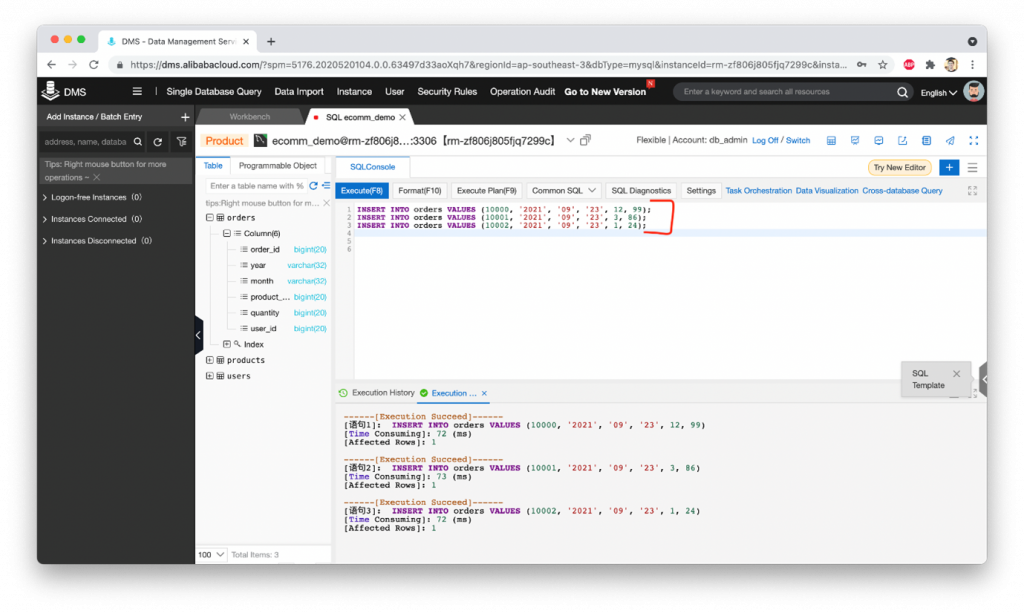
Note, the three records we inserted were:
INSERT INTO orders VALUES (10000, ‘2021’, ’09’, ’23’, 12, 99); INSERT INTO orders VALUES (10001, ‘2021’, ’09’, ’23’, 3, 86); INSERT INTO orders VALUES (10002, ‘2021’, ’09’, ’23’, 1, 24);Now, let’s go back to our dashboard and see if it has updated to show the new total number of orders:
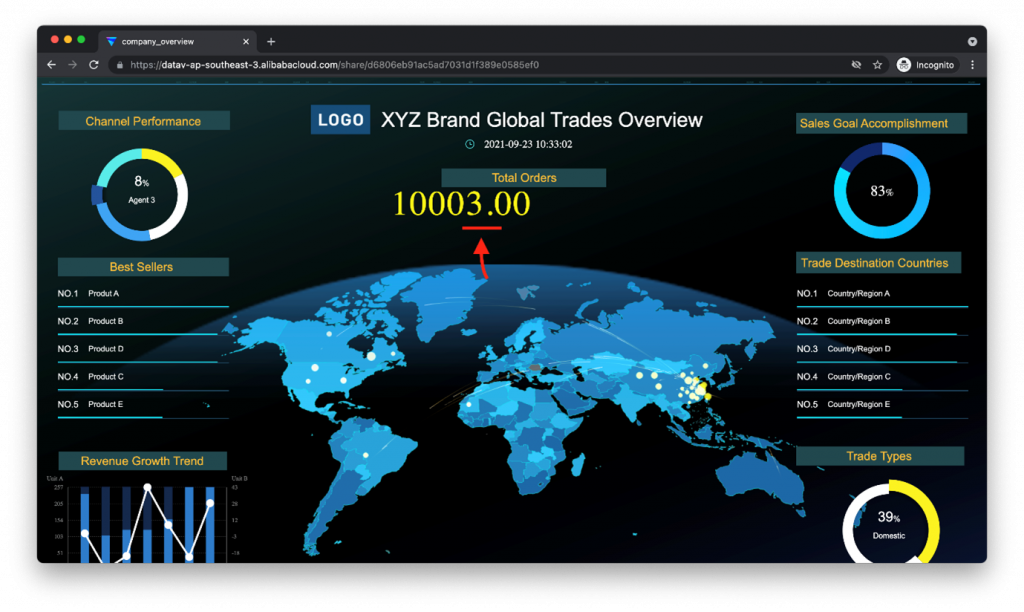
Yep! We see three more orders than before! The dashboard has updated automatically to reflect the changes in the source database. Nice!
Next Steps __________________________________________________
ตอนนี้คุณรู้วิธีสร้างแดชบอร์ด DataV จากเทมเพลต ทำการปรับเปลี่ยนสไตล์และแหล่งข้อมูล เผยแพร่แดชบอร์ดของคุณ และตรวจสอบว่าทำงานตามที่ตั้งใจไว้! สำหรับข้อมูลเพิ่มเติมเกี่ยวกับวิธีสร้างและแก้ไขแดชบอร์ด DataV โปรดดูคู่มือการเริ่มต้นฉบับย่อในเอกสารอย่างเป็นทางการ เจอกันคราวหน้า!